


GSIS Weekly: The Market in Review
Week ended November 20, 2026
- Stocks posted their weakest week since April 2025 as AI concerns outweighed strong earnings.
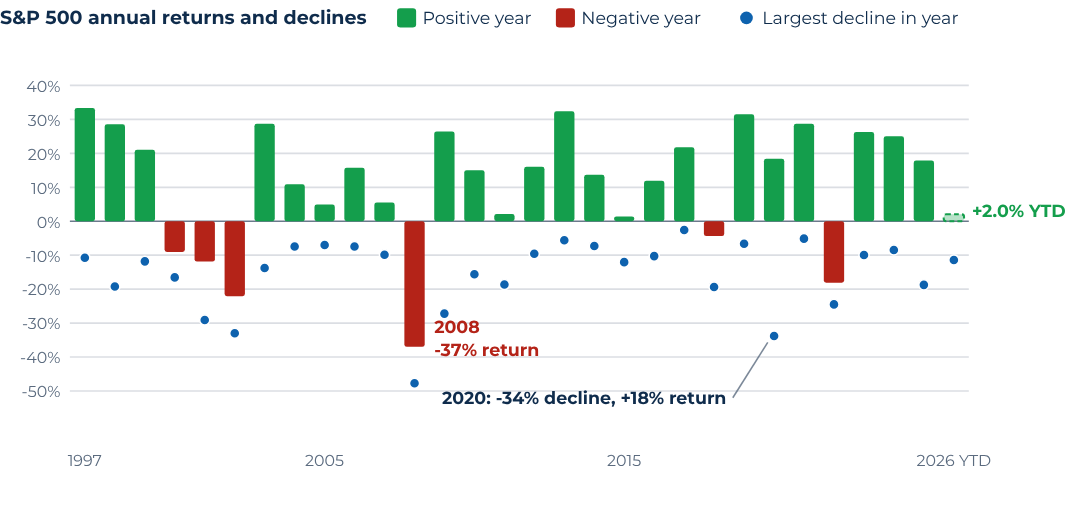
- Declines are a normal part of market history, even in years that finish higher.
- Fed minutes showed almost all officials expect more rate increases.
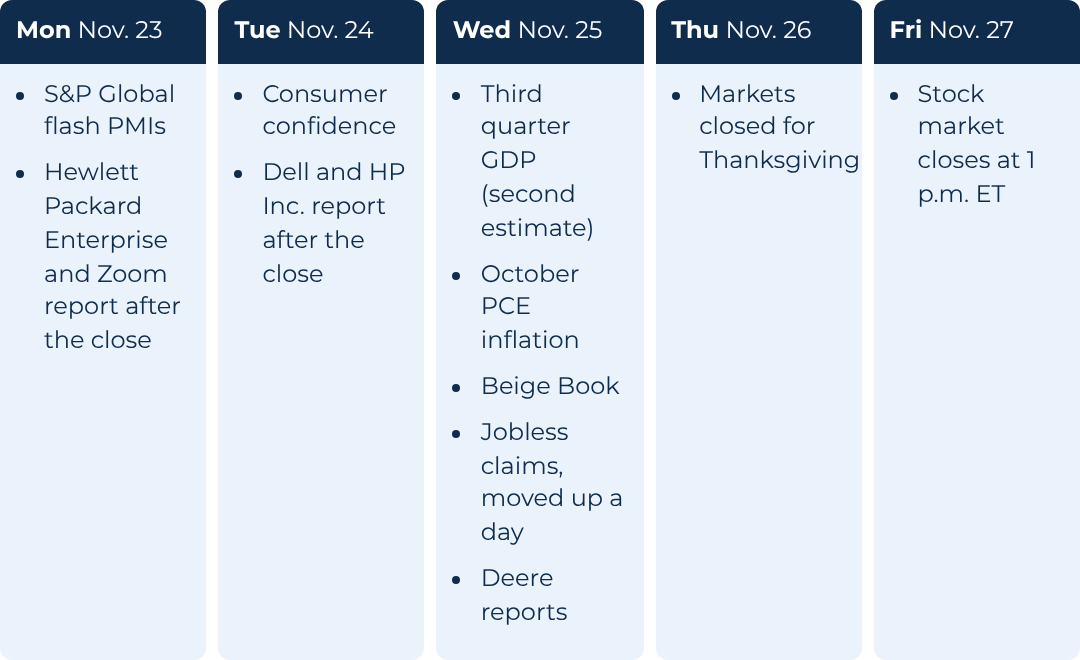
- Next week is shortened by Thanksgiving, with inflation data due Wednesday.
- Stock valuations are lower, with prices falling while earnings estimates kept rising.
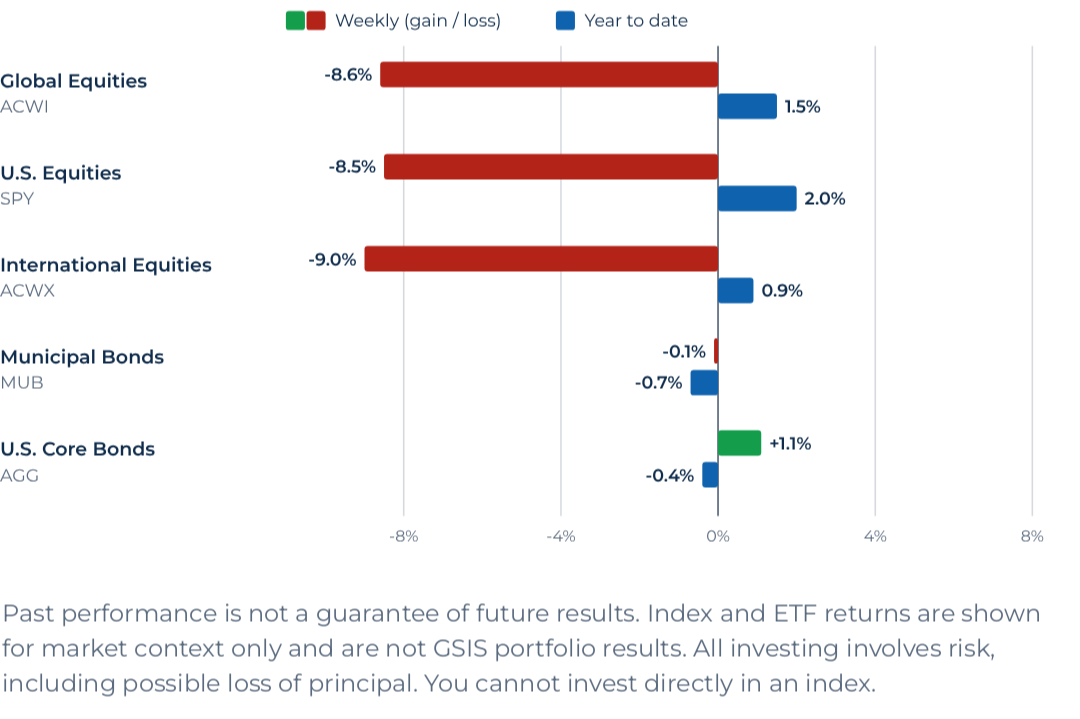
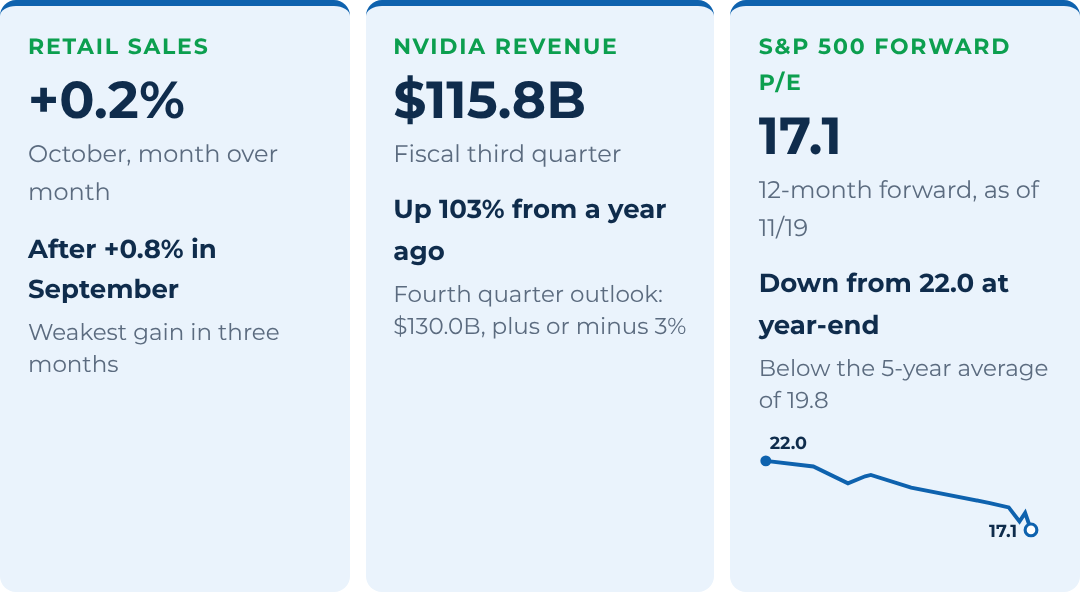
Stocks had their worst week since April 2025 as concerns about artificial intelligence (AI) spending outweighed strong earnings. The S&P 500 fell for a seventh straight session on Friday, and all 11 sectors were lower on the week. Nvidia reported results above expectations and raised its outlook, yet its shares fell. International stocks fell more than U.S. stocks, and the U.S. dollar traded near a 19-month high.
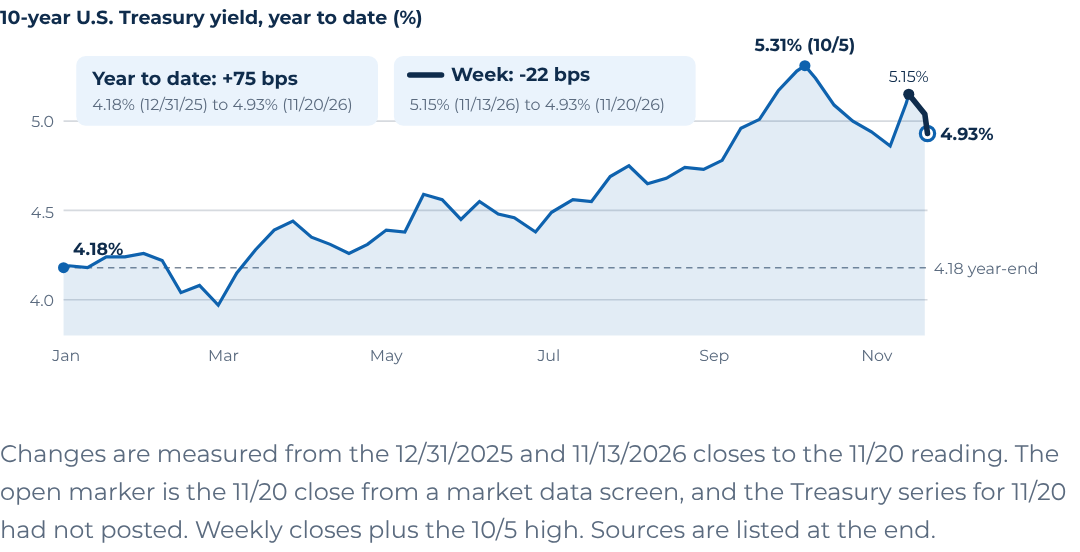
Bond prices rose as the 10-year Treasury yield declined for a fifth straight session on Friday, to below 5%.
Fed Watch
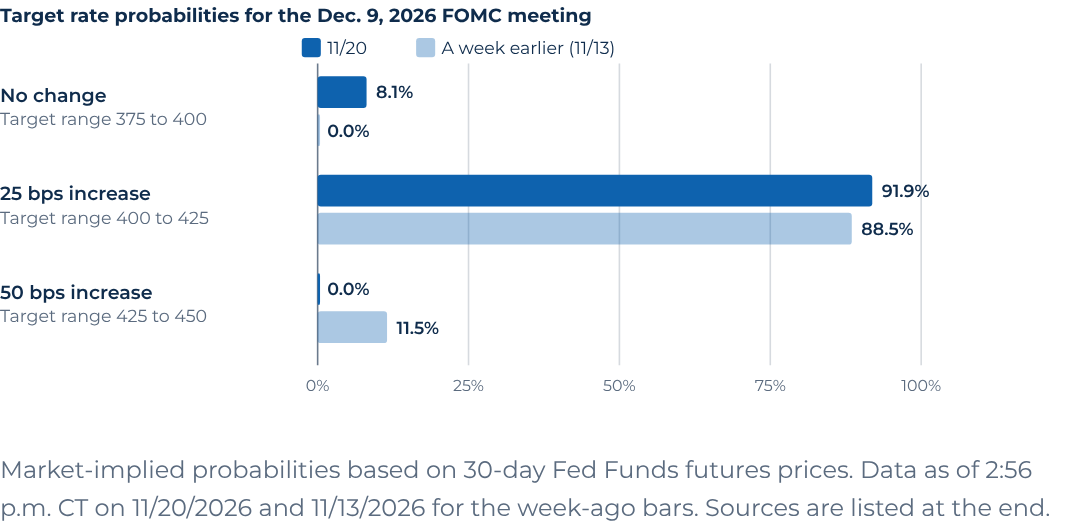
Minutes from the Fed's October meeting showed almost all officials expect further rate increases. Two officials said a move larger than a quarter point could be worth considering in December if inflation data come in unfavorable, and Governor Christopher Waller said on CNBC that the Fed should consider a half-point increase. As of late Friday afternoon, CME FedWatch showed a 91.9% probability of a 25 bps increase at the Dec. 9 meeting and an 8.1% probability of no change. A week earlier, it showed 88.5% for a 25 bps increase and 11.5% for 50 bps.
One Thing to Watch
Market declines happen every year. As of the Nov. 20 close, the S&P 500 was about 11% below its Oct. 6 record on a total return basis, measured by SPY. Pullbacks like this are part of how markets work. Over the last 30 years, the index had a decline at some point in every calendar year, and the largest decline within a year averaged about 15%. It still had a positive total return in 23 of the 29 full calendar years from 1997 through 2025, and it is up about 2% so far in 2026, after falling about 9% from late January to the end of March. Six of those years were negative, including 2008, when the index lost 37%.
Looking Ahead
Return figures are from YCharts and Koyfin. ETF figures combine YCharts total returns through 11/19/2026 with the Koyfin price return for 11/20/2026. The Treasury figure is the 10-year U.S. Treasury yield, not a total return. This commentary is for general informational purposes only and is not investment advice or a recommendation to buy or sell any security.
Largest decline is the largest peak-to-trough fall in the daily total return level within each calendar year, measured from the prior year-end close. 2026 is year to date through 11/19 and uses SPY's total return, the same figure as the returns chart above. Earlier years use the S&P 500 Total Return index. Sources are listed below.
The S&P 500 is shown for general market context only. It is not a GSIS portfolio, and GSIS client portfolios are not invested solely in the S&P 500, so their results can differ. Past performance is not a guarantee of future results. All investing involves risk, including possible loss of principal. You cannot invest directly in an index. Returns are total returns, which include reinvested dividends, and do not reflect fees, expenses, or taxes.
- ETF returns: YCharts total returns, year to date through 11/19/2026 and for the week from the 11/13/2026 close through 11/19/2026. Koyfin closing prices for 11/20/2026 (price return for the day).
- 10-year Treasury yield: Treasury constant maturity series via YCharts, daily closes through 11/19/2026 (5.15% on 11/13/2026 and 5.04% on 11/19/2026; 4.18% on 12/31/2025). Koyfin close for 11/20/2026 (4.931%).
- Stock market moves, sector performance and the six-session losing streak: Yahoo Finance, Investrade and Reuters via MarketScreener, 11/19/2026 to 11/20/2026. Worst week since April 2025: Reuters and CNBC, 11/20/2026. Dollar near a 19-month high: Investrade, 11/20/2026.
- Fed minutes, the two officials open to a larger December move and Governor Waller's remarks: Federal Reserve minutes released 11/18/2026 as reported by CNBC, Bloomberg and The Associated Press.
- Retail sales: U.S. Commerce Department via CNN, 11/17/2026.
- NVIDIA revenue and outlook: NVIDIA's third quarter fiscal 2027 earnings release, 11/17/2026. Analyst expectation of about $109 billion: LSEG via The Globe and Mail. Jensen Huang's resignation: Yahoo Finance and Reuters, 11/12/2026 to 11/18/2026.
- S&P 500 annual returns and largest declines, 1997 to 2025: YCharts S&P 500 Total Return index (^SPXTR), daily, 11/15/1996 to 12/31/2025, with GSIS calculations. The 2026 bar and the decline from the 10/6/2026 record: YCharts total return of the SPDR S&P 500 ETF Trust (SPY), through 11/19/2026.
- Calendar: Schwab, Investrade, Admiral Markets and CMC Markets, 11/19/2026 to 11/20/2026.
- Fed rate probabilities: CME FedWatch tool (CME Group), probabilities for the 12/9/2026 FOMC meeting as of 2:56 p.m. CT on 11/20/2026, with the 11/13/2026 comparison shown by the tool.
- S&P 500 forward 12-month price-to-earnings ratio: FactSet Earnings Insight, 11/20/2026 (17.1 as of the 11/19/2026 close, with the 5-year average of 19.8 and 10-year average of 19.1). The year-end figure of 22.0 (12/31/2025) is from the 11/6/2026 edition. Other readings in the small chart: FactSet Earnings Insight editions dated 2/27, 4/10, 5/1, 6/26, 10/23, 11/6 and 11/13/2026 and the 9/30/2026 end-of-quarter figure.