


GSIS Weekly: The Market in Review
Week ended October 16, 2026
Stocks fell this week as a sell-off in artificial intelligence (AI) related shares, higher oil prices, and a hotter inflation report overshadowed the start of earnings season. Bonds gained as yields eased from multi-decade highs.
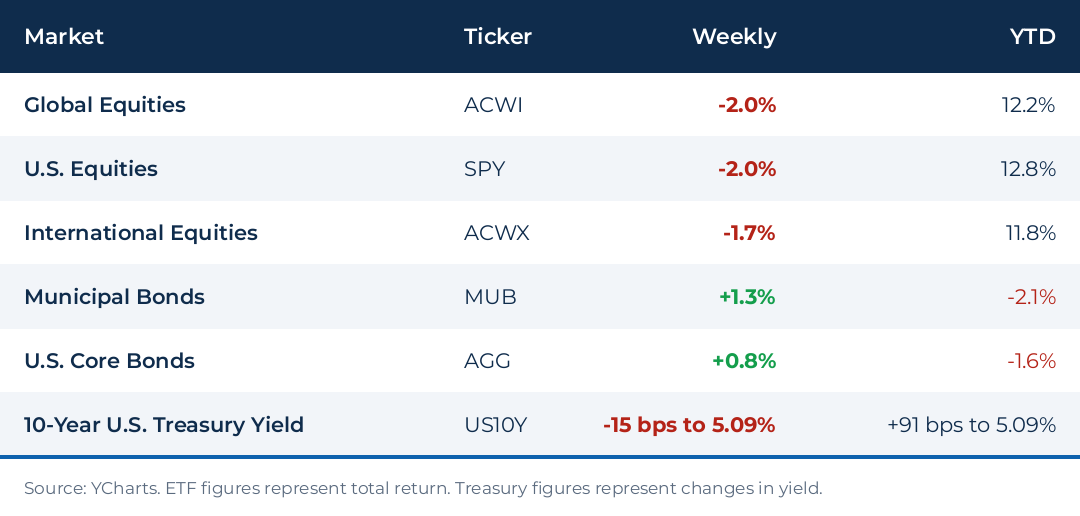
Bond prices rose as the 10-year Treasury yield declined 15 bps to 5.09%, easing some of the pressure from recent highs. The Bloomberg-reported pricing for an October rate hike fell to roughly 15%.
U.S. oil moved above $100 a barrel, up about $10 on the week, as attacks in the Middle East escalated and shipping risks in the Strait of Hormuz increased. Higher energy costs remain a risk to the inflation outlook.
Technology led the decline. The Nasdaq-100 fell about 5%, its weakest week since the April 2025 tariff turmoil. Chipmakers declined for an eighth straight session, the longest streak since 2008, as investors questioned whether AI infrastructure spending can earn an adequate return, particularly for companies that rely on debt financing. International stocks held up modestly better than U.S. stocks, with ACWX down 1.7% against 2.0% for SPY.
Fed Watch
September CPI rose 3.7% from a year earlier, above the 3.6% expected, and core CPI rose 2.6%. Fed officials signaled they are likely to pause in October rather than raise rates.
One Thing to Watch
Credit conditions for heavily indebted AI companies. Higher borrowing costs may limit how quickly they can fund new investment.
Looking Ahead
Next week is lighter on economic data, with housing starts and building permits, S&P Global purchasing managers surveys, and weekly jobless claims. Earnings are the focus, with reports due from Meta, Tesla, Netflix, GE Aerospace, and RTX, among others. Fed officials are in their quiet period ahead of the October policy meeting, so no Fed speeches are expected. Oil prices and company updates tied to AI spending round out the week.
Return-table figures are from YCharts. ETF figures are total returns. The Treasury figure is the 10-year U.S. Treasury yield, not a total return. This commentary is for general informational purposes only and is not investment advice or a recommendation to buy or sell any security.